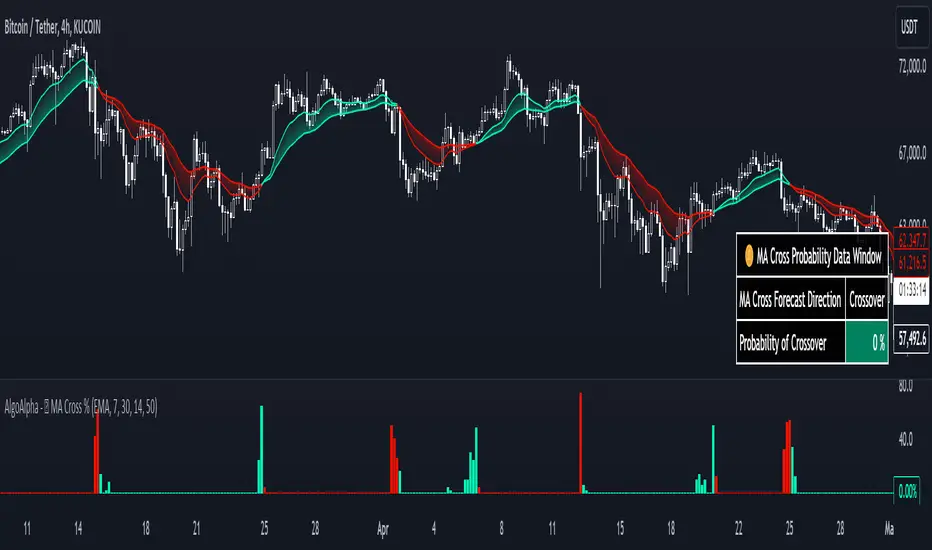
Moving Average Cross Probability [AlgoAlpha]Moving Average Cross Probability 📈✨
The Moving Average Cross Probability by AlgoAlpha calculates the probability of a cross-over or cross-under between the fast and slow values of a user defined Moving Average type before it happens, allowing users to benefit by front running the market.
✨ Key Features:
📊 Probability Histogram: Displays the Probability of MA cross in the form of a histogram.
🔄 Data Table: Displays forecast information for quick analysis.
🎨 Customizable MAs: Choose from various moving averages and customize their length.
🚀 How to Use:
🛠 Add Indicator: Add the indicator to favorites, and customize the settings to suite your trading style.
📊 Analyze Market: Watch the indicator to look for trend shifts early or for trend continuations.
🔔 Set Alerts: Get notified of bullish/bearish points.
✨ How It Works:
The Moving Average Cross Probability Indicator by AlgoAlpha determines the probability by looking at a probable range of values that the price can take in the next bar and finds out what percentage of those possibilities result in the user defined moving average crossing each other. This is done by first using the HMA to predict what the next price value will be, a standard deviation based range is then calculated. The range is divided by the user defined resolution and is split into multiple levels, each of these levels represent a possible value for price in the next bar. These possible predicted values are used to calculate the possible MA values for both the fast and slow MAs that may occur in the next bar and are then compared to see how many of those possible MA results end up crossing each other.
Stay ahead of the market with the Moving Average Cross Probability Indicator AlgoAlpha! 📈💡
Cari dalam skrip untuk "MA Cross"
X48 - Strategy | MA Type Cross + TPSL | Future&Spot | V.2Thank You For Open Source Code, This Strategy Ref. By 1.Simple Strategy Like MA Crossover For Long/Short or Spot Trade, 2. CDC Action Zone V.2 for BarPaint
This Strategy Mixing With MA Crossover Strategy and BarPaint By CDC Action Zone and TP/SL by Varbara
### How To Use Strategy : Setting EMA/SMA Crossover EMA/SMA, Any Value If You Want
For Long Position : Cross Up
For Short Position : Cross Down
Can Use With Spot Trade : Cross Up = Buy, Cross Down = Sell
TP/SL When Your OrderSize Change From any % Of Your TP/SL Value
### In Strategy Setting
Intitial Capital = Ex. 200
Order Size = Should Be Money Management Not Use 100% of Capital Ex. 10% of Capital (200$) = Order Size 20$
StopLoss and Take Profit = If You Run Trend TF 4H+ or 1D+ You Can Change TP% = 1,000% for nonlimit and Stop Loss 5 - 20% from your order size
Ex. Stoploss 15% = OrderSize / 100 x %SL = 20$/100 x 15% = 3$ Loss from order size 20$ (if you not set stop loss.)
Base Currency = (Your Currency) # Ex. USD
Commission = (Your Trading Fee) # Ex. Future Fee Can Check At Binance Fee Rate > www.binance.com > Choose Your Fee Type, Ex. USD M Future (Regular User) = 0.02 (Maker), 0.04 (Taker)
Commission Symbol Type = % # (Ref. By Binance Fee Rate)
### Notice ####
Default Setting It's Realistic From Normal Life Ex. Capital 200$ / Ordersize 20$ (10%)/ Commission 0.1% (Buy+Sell) / Slippage = 2 / TP = 1000% (nonlimit) / SL = 15%/OrderSize
Low Risk But High Return, Good Luck
### Bot Auto Trade by X4815162342 ###
if you wanna try my bot auto trade X48-3in1-bot : Contact My Line ID : x4815x
Full Command Alert For This Strategy If You Wanna See It's
'{"ex":"'+markettype+'","side": "'+longcommand+'", "amount": "@{{strategy.order.contracts}}", "symbol": "{{ticker}}", "passphrase": "'+passphrase+'","leverage":"'+str.tostring(leveragex)+'"}'
'{"ex":"'+markettype+'","side": "'+shortcommand+'", "amount": "@{{strategy.order.contracts}}", "symbol": "{{ticker}}", "passphrase": "'+passphrase+'","leverage":"'+str.tostring(leveragex)+'"}'
But Easy Than Full Command Just Use Thisssssss !! Strategy Be Manage Auto Long and Short or TPSL Position
You Don't Do Anything Just Use This Message to Alerts Message
{{strategy.order.alert_message}}
### If you don't use bot but just looking for strategy test ####
Just Pass Bot Setting Function It's Nothing Effect For Strategy !!!!!!
Let's Enjoy With Your Strategy BackTest 😁
Remember Beware Max drawdown%. I'm Recommend Lower Than 10% It's Very Good.

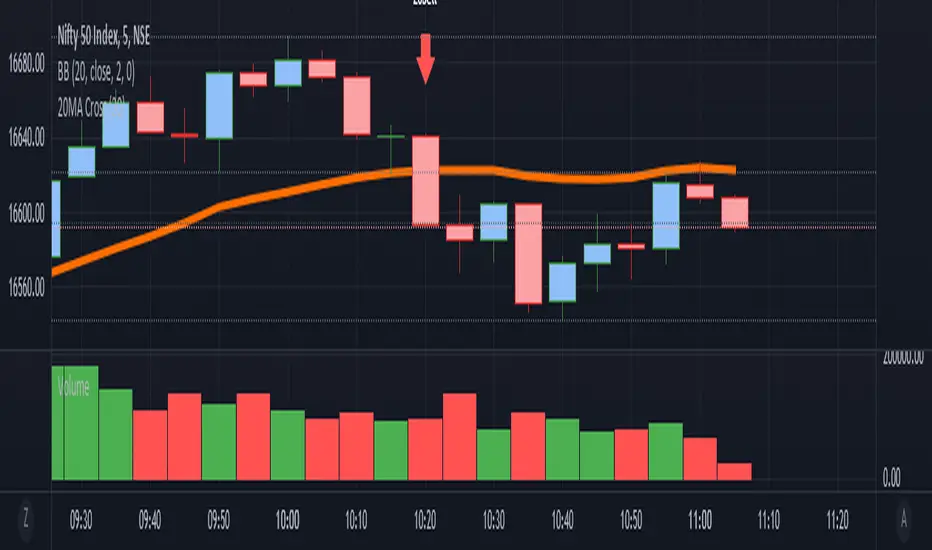
it is a simple Ma cross alert. We can set any ma period.Simple alert for 20MA cross. We can set any ma period.
it plots the crossing candle. This script is purely testing purpose.
KAMIKAMI EMA RIBBONGood evening plebians, This IS Cryptofilio, Your dark knight in the Crypto lightness.... Introducing yet another nebulous indicator... It's the KAMI, KAMI (GODS in Japanese) EMA ribbon.....
This indicator uses 3 primary lengths of EMA labeled as Short, Medium, and Long. They change colors in relation to each other and in relation to the current price of the security.
This indicator is more sophisticated than a simple MA cross strategy as you can use a wider variety of signals for entering earlier and exiting earlier, thus getting into a trade early in the run-up and getting out before the run-down. The EMA is identifiable by the color, lighter green and red representing lower lookbacks. When the OHLC4 crosses the ema it changes color. Thus if all colors are red, then the security is trading below all EMA's - a strong sell or short signal.
GREEN inside of RED indicates an uptrend within a larger downtrend... and of course, the inverse is also true.
The triangles which indicate a cross, are color-coded according to their significance by transparency - the less transparent the more important or significant the cross.
In addition, there are bull and bear bounce indicators (the arrows) that predict a bounce up or down from the security meeting a point along the EMA line and reacting.
VARIATIONS: To use this for scalping I suggest 5,8,13

Two Moving Average CrossChoose two completely different moving averages and determine crossover points. Feel free to copy and paste the code into any strategy using MA crosses in order to optimize backtesting.

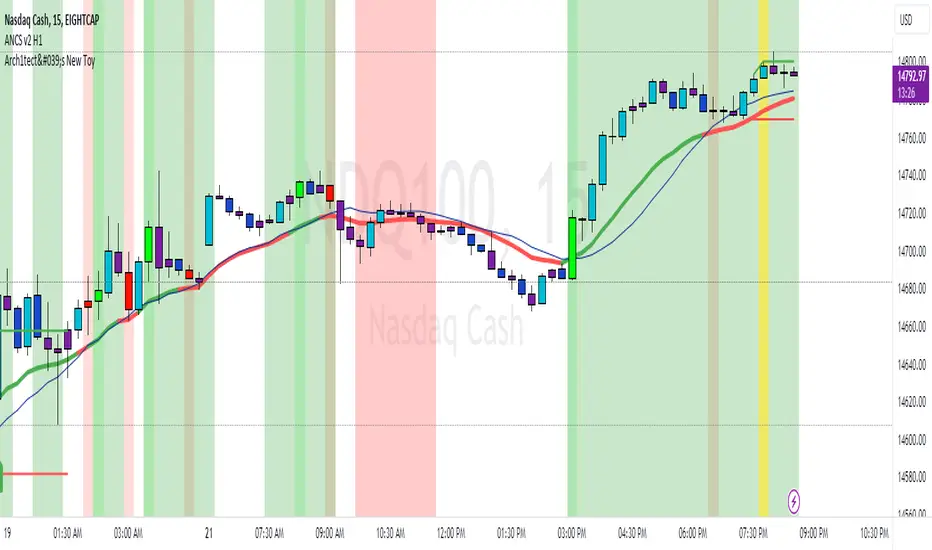
Arch1tect's New ToyDescription:
Arch1tect's New Toy tries to predict market trends by simply utilising 2 moving averages crossovers.
How it works:
Buy signals are triggered when the faster MA crosses over the slower MA from the downside to the upside.
Sell signals are triggered when the faster MA crosses under the slower MA from the upside to the downside.
How to use:
Take buys when buy signal is triggered AND close existing sell position
Take sells when sell signal is triggered AND close existing buy position
Note:
Settings are optimised for XAUUSD on the M1 chart.
Extra:
Alerts are included.
You can toggle between EMA , WMA and SMA to your liking.
Strategy Tester version:
Arch1tect's New Toy (Strategy Tester Version)Description:
The version of Arch1tect's New Toy indicator with Strategy Tester added.
This indicator tries to predict market trends by simply utilising 2 moving averages crossovers.
How it works:
Buy signals are triggered when the faster MA crosses over the slower MA from the downside to the upside.
Sell signals are triggered when the faster MA crosses under the slower MA from the upside to the downside.
How to use:
Take buys when buy signal is triggered AND close existing sell position
Take sells when sell signal is triggered AND close existing buy position
Note:
Settings are optimised for XAUUSD on the M1 chart.
Extra:
Alerts are included.
You can toggle between EMA, WMA and SMA to your liking.
Indicator version:

Adjustable MA & Alternating Extremities [LuxAlgo]Returns a moving average allowing the user to control the amount of lag as well as the amplitude of its overshoots thanks to a parametric kernel. The indicator displays alternating extremities and aims to provide potential points where price might reverse.
Due to user requests, we added the option to display the moving average as candles instead of a solid line.
Settings
Length: MA period, refers to the number of most recent data points to use for its calculation.
Mult: Multiplicative factor for each extremity.
As Smoothed Candles: Allows the user to show the MA as a series of candles instead of a solid line.
Show Alternating Extremities : Determines whether to display the alternating extremities or not.
Lag: Controls the amount of lag of the MA, with higher values returning a MA with more lag.
Overshoot: Controls the amplitude of the overshoots returned by the MA, with higher values increasing the amplitude of the overshoots.
Usage
Moving averages using parametric kernels allows users to have more control over characteristics such as lag or smoothness; this can greatly benefit the analyst. A moving average with reduced lag can be used as a leading moving average in a MA crossover system, while lag will benefit moving averages used as slow MA in a crossover system.
Increasing 'Lag' will increase smoothness while increasing 'overshoot' will reduce lag.
The following indicator puts more emphasis on its alternating extremities, an upper extremity will be shown once the high price crosses the upper extremity, while a low extremity will be shown once the low price crosses the lower extremity. These can be interpreted like extremities of a band indicator.
The MA using a length value of 200 with a multiplicative factor of 1.
In general, extremities will effectively return points where price might potentially bounce in ranging markets while closing prices under trending markets will often be found above an upper extremity and under a lower extremity.
Reducing the lag of the moving average allows the user to obtain a more timely estimate of the underlying trend in the price, with a better fit overall. This allows the user to obtain potentially pertinent extremities where price might reverse upon a break, even under trending markets.
In the above chart, the price initially breaks the upper extremity, however, we can observe that the upper extremity eventually reaches back the price, goes above it, provides a resistance, and effectively indicates a reversal.
Users can plot candles from the moving average, these are fairly similar to heikin-ashi candles in the sense that CandleOpen(t) ≠ CandleClose(t-1) , each point of the candle is calculated as follows for our indicator:
Open = Average between MA(t-1) and MA(t-2)
High = MA using the high price as input
Low = MA using the low price as input
Close = MA using the closing price as input
Details
Lag is defined as the effect of moving averages to reflect past price variations instead of new ones, lag can be observed by the user and is the main cause of false signals. Lag is proportional to the degree of filtering returned by the moving average.
Overshooting is a common effect encountered in non-lagging moving averages, and is defined as the tendency of a moving average to exceed a maximum level (or minimum level, which can be defined as undershooting )
MA and rolling maximum/minimum, both using a length of 50 bars. While we can think of lag as a cost of smoothness, we can think of overshooting as a cost for reduced lag on some occasions.
Explaining the kernel design behind our moving average requires understanding of the logic behind lag reduction in moving averages. This can prove to be complex for non informed users, but let's just focus on the simpler part; moving averages can be defined as a weighted sum between past prices and a set of coefficients (kernel).
MA(t) = b(0)C(t) + b(1)C(t-1) + b(2)C(t-2) + ... + b(n-1)C(t-n-1)
Where n is the period of the moving average. Lag is (non optimally) reduced by "underweighting" past prices - that is multiplying them by negative numbers.
The kernel used in our moving average is based on a modified sinewave. A weighted sum making use of a sinewave as a kernel would return an oscillator centered at 0. We can divide this sinewave by an increasing linear function in order to obtain a kernel allowing us to obtain a low lag moving average instead of a centered oscillator. This is the main idea in the design of the kernel used by our moving average.
The kernel equation of our moving average is:
sin(2πx^α)(1 - x^β)
With 1>x>0 , and where α controls the lag, while β controls the overshoot amplitude.
Using this equation we can obtain the following kernels:
Here only α is changed, while β is equal to 1. Values to the left would represent the coefficients for the most recent prices. Notice how the most significant coefficients are given to the oldest prices in the case where α increases.
Higher overshoot would require more negative values, this is controlled by β
Here only β is changed, while α is equal to 1. Notice how higher values return lower negative coefficients. This effectively increases the overshoots amplitude in our moving average. We can decrease α in order for these negative coefficients to underweight more recent values.
Using α = 0 allows us to simplify the kernel equation to:
1 - x^β
Using this kernel we can obtain more classical moving averages, this can be seen from the following results:
Using β = 1 allows us to obtain a linearly decreasing kernel (the one of a WMA), while increasing allows the kernel to converge toward a rectangular kernel (the one of SMA).

White MAThis modified indicator just based on my 2cent strategy & experience,
which is:-
MA6, MA20, MA50, MA200
However, I always turn off MA20 since I also use BB (20) indicator.
Generally, if small MA cross up big MA, then it becomes entry signal, & vice versa
Each entry signal need confirmation state which is next price should close higher than crossing price.
If price close lower than crossing price, then it will be invalid entry's signal,
while if price keep maintain at same value, then it's mean uncertain for me until it close whether above or below crossing price.
"Strategy 1" (General)
In TF1D, the pattern should fulfill my condition as below:-
- MA20 above MA50 (bullish uptrend)
- Price pullback at least touch MA20 for reversal (making Higher Low)
- Price break resistance of pullback's price
My entry signal only after it close above the resistance, near "support" (RBS, Resistance become Support)
My stop-loss, if and only if price touch previous SMA6 price (or SMA10)
Unfortunately, I haven't had any specific target price. It's depending on what kind of "player" you are. (achievement)
Few TPs those I used:-
- Price touch my Static Resistance on chart obtained from,
~ Pullback price
~ Fibo (1.61++)
~ Higher price in 3 months, 6 months, 1 year, 3 year, and so on. (road to ATH, All Time High)
- Price close outside Upper BB (Dynamic Resistance)
I don't assume sell signal by using crossing indicator as TP, it's more to stop-loss for me. (means stop from loss your profit)
"Strategy 2" (Reversal Entry)
In TF15 minutes, we are assuming entry signal when SMA6 cross up SMA50. However, it's still need confirmation by next closing price.
This strategy can be apply in TF1D although SMA20 doesn't cross up SMA50 yet.
That's all my sharing strategy/system based on my 2cent experience, it's not a prefects strategy but I hope it will gives some idea for you guys in order to obtain your own system.

Combined EMA & MA crossovers [CDI]Implementation of the strategy of moving averages crossings combining two fast and two slow that are used to confirm the entry.
The purpose is to be able to quickly see a backtesting of the strategy by easily configuring the profit / loss percentage. In this script the profit percentage is used for the loss percentage as well.
Additionally you can see the moving averages all in a single chart tool.
In the community to which I belong, this strategy is used in daily candles, especially for swing trading, but it can be used in different time frames.
WARNING:
- For purpose educate only
- The entries are used under your responsibility

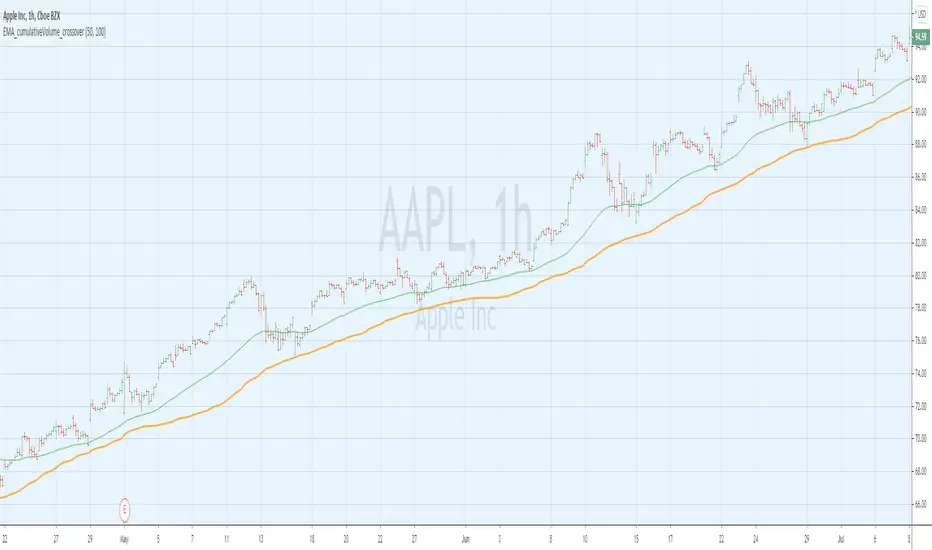
EMA_cumulativeVolume_crossover [indicator]while I was doing some research with exp MA crossovers and volume indicator , I have noticed that when ema 50 is above cumulative volume of 100 period , shows to capture nice profits in that trend. Shorting also (ema50 cross down volume of 100 period) also shows nice results.
BUY
When ema50 crossover cumulative volume of 100 period
Exit
When ema50 cross down cumulative volume of 100 period
Short Selling
Reverse above BUY conditions
Back ground color shows blue when ema50 is above cumulative volume of 100 period, shows purple when ema50 is below cumulative volume of 100 period
I will publish the strategy for back testing later today
Warning
For the use of educational purpose only
Bitlinc MARSI Study AST w/ Take Profit & Stop loss - beta 0.1This script is beta 0.1 - will update as soon as the script is tradable
This script is based on AST on a 10 minute timeframe. You can change the asset and the timeframe for any asset you want to trade, but for it to work correct ALL settings have to be testes in the Strategy section of the TradingView. Each assets and timeframe require a different mixture of settings. This is NOT a one settings fits all trading for all assets on any timeframe. Below are the settings and explanation on how it works.
How it fires a buy / sell:
The script will plot an RSI with upper and lower bands in a separate indicator window. The idea behind this script is to fire a LONG when MA crosses OVER lower band and fire a SHORT when the MA crosses under the lower band. Each order that fires is an OCO (Order Cancels Order) for pyramiding.
Settings:
You have full control of these settings as mentioned above, you must configure every part of this script for each asset and timeframe you trade.
- Length of MA
- Length
- Upper bands of RSI
- Lower bands of RSI
- Take profit percentage
- Stop loss percentage
- Month to start and end the strategy (within 2020)
- Day to start and end the strategy (within 2020)
- Quantity type
- Slippage
- Pyramiding
***Remember that after the signal to enter or exit a trade is fired, the alert will trigger AFTER the close of the candle that caused the tigger to fire

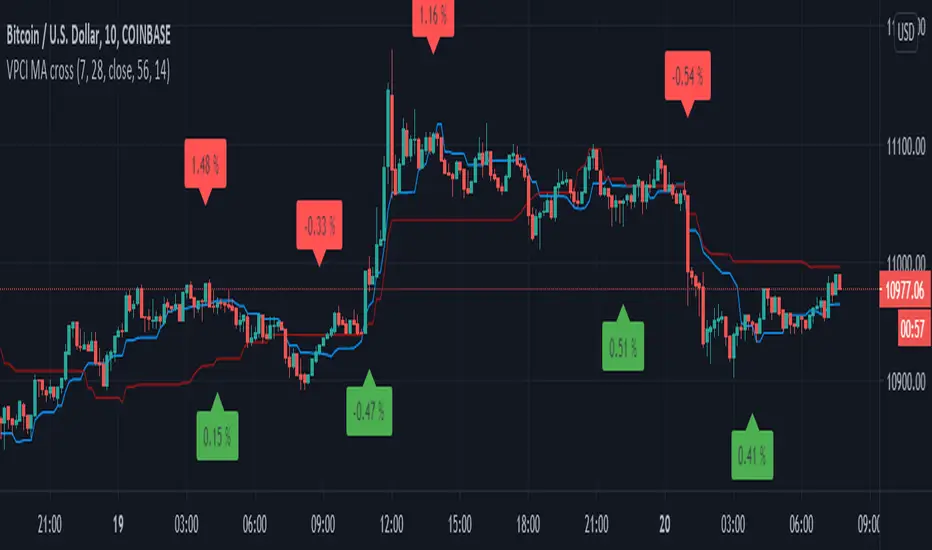
VPCI MA cross [LM]Hello guys,
I would like to introduce you a script that combines two indicators: VPCI( volume price confirmation indicator) and donchian MAs
VPCI:
Fundamentally, the VPCI reveals the proportional imbalances between price trends and volume-adjusted price
trends. An uptrend with increasing volume is a market characterized by greed supported by the fuel needed to
grow. An uptrend without volume is complacent and reveals greed deprived of the fuel needed to sustain itself.
Investors without the influx of other investors ( volume ) will eventually lose interest and the uptrend should
eventually breakdown.
A falling price trend reveals a market driven by fear. A falling price trend without volume reveals apathy, fear
without increasing energy. Unlike greed, fear is self-sustaining, and may endure for long time periods without
increasing fuel or energy. Adding energy to fear can be likened to adding fuel to a fire and is generally bearish
until the VPCI reverses. In such cases, weak-minded investor's, overcome by fear, are becoming irrationally
fearful until the selling climax reaches a state of maximum homogeneity. At this point, ownership held by weak
investor’s has been purged, producing a type of heat death capitulation. These occurrences may be visualized by
the VPCI falling below the lower standard deviation of a Bollinger Band of the VPCI, and then rising above the
lower band, and forming a 'V' bottom.
I have used MA's on top of VPCI and looking for crosses. Percatage that is shown in label is calculation of difference between previous cross and current close price. So you know if you would be flipping what % you would gain or loose, all is rounded with precission of two
DONCHIAN
I took donchain calculation from ichimoku to calculate conversion line and base line(both are giving me information about whether it's trending or not and distance from the mean)
There are various sections in setting:
VPCI - setting of MA lengths(for smaller timeframes I recommend using bigger MA length)
DONCHAIN - setting length for conversion and base line
Any suggestions are welcome
3 MA Smart Money System v6 (No Repaint)✅ INDICATOR SPECIFICATIONS
🎯 Moving Average Type
SMA – Simple Moving Average
EMA – Exponential Moving Average
HMA – Hull Moving Average
🔥 Complete Features
✔ 3 moving averages in 1 indicator
✔ SMA/EMA/HMA options
✔ Turn each moving average on/off
✔ Multi-Timeframe (MTF)
✔ Auto Color Trend
✔ MA labels on the chart
✔ Alerts for all moving average combinations
✔ Color fill between moving averages (trend zones)
✔ Automatic MA crossover strategy (Buy/Sell)
✔ Smart Money + Moving Average (major trend filter)
✔ Moving average as automatic support & resistance
✔ NO REPAINT (safe for backtesting & live use)
🧠 SYSTEM LOGIC
MA 3 = Smart Money MA (main trend)
BUY
MA1 crosses UP MA2
Price above MA3
SELL
MA1 MA2 crosses down
Price below MA3
The MA3 zone is considered dynamic support/resistance.
Created by Dr. Trade

sullaojo 3mHere is the English translation for the alert setup instructions:
**How to Set Up Alerts (After Adding the Code)**
1. Click the **Add to chart** button to apply the indicator to your graph.
2. Click the **Alarm Clock icon (Alerts)** on the top right toolbar of TradingView, or press `Alt + A`.
3. In the **Condition** field:
* Select the indicator named **"MA Crossover Buy Alert..."**
* Select **"แจ้งเตือนซื้อ (Buy Alert)"** to receive only buy signals.
4. In the **Trigger** (or Options) section: Select **Once per bar close**.
*(This is recommended per the textbook to confirm that the closing price actually crossed the line, avoiding false signals during intraday volatility.)*
5. Check **Notify on App** (for mobile) or **Show pop-up** as desired, then click **Create**.
Now, when the moving averages cross according to the textbook's conditions, the system will send you an alert immediately!

SMA Cross PreventionTraditional MA crossover indicators are reactive — they tell you a cross happened after the fact.
This indicator is prescriptive — it tells you exactly what price action is required to prevent a cross from happening.
The Core Insight
When a fast MA is above a slow MA but they're converging, traders ask: "Will we get a death cross?"
This indicator answers a more useful question:
"What is the minimum price path required to prevent the cross?"
By treating the MA structure as a constraint and solving for the required input (future prices), we transform a lagging indicator into a forward-looking risk assessment tool.

Hyper Insight MA Strategy [Universal]Hyper Insight MA Strategy ** is a comprehensive trend-following engine designed for traders who require precision and flexibility. Unlike standard indicators that lock you into a single calculation method, this strategy serves as a "Universal Adapter," allowing you to **Mix & Match 13 different Moving Average types** for both the Fast and Slow trend lines independently.
Whether you need the smoothness of T3, the responsiveness of HMA, or the classic reliability of SMA, this script enables you to backtest thousands of combinations to find the perfect edge for your specific asset class.
---
🔬 Deep Dive: Calculation Logic of Included MAs
This strategy includes 13 distinct calculation methods. Understanding the math behind them will help you choose the right tool for your specific market conditions.
#### 1. Standard Averages
* **SMA (Simple Moving Average):** The unweighted mean of the previous $n$ data points.
* *Logic:* Treats every price point in the period with equal importance. Good for identifying long-term macro trends but reacts slowly to recent volatility.
* **WMA (Weighted Moving Average):** A linear weighted average.
* *Logic:* Assigns heavier weight to current data linearly (e.g., $1, 2, 3... n$). It reacts faster than SMA but is still relatively smooth.
* **SWMA (Symmetrically Weighted Moving Average):**
* *Logic:* Uses a fixed-length window (usually 4 bars) with symmetrical weights $ $. It prioritizes the center of the recent data window.
#### 2. Exponential & Lag-Reducing Averages
* **EMA (Exponential Moving Average):**
* *Logic:* Applies an exponential decay weighting factor. Recent prices have significantly more impact on the average than older prices, reducing lag compared to SMA.
* **RMA (Running Moving Average):** Also known as Wilder's Smoothing (used in RSI).
* *Logic:* It is essentially an EMA but with a slower alpha weight of $1/length$. It provides a very smooth, stable line that filters out noise effectively.
* **DEMA (Double Exponential Moving Average):**
* *Logic:* Calculated as $2 \times EMA - EMA(EMA)$. By subtracting the "lag" (the smoothed EMA) from the original EMA, DEMA provides a much faster reaction to price changes with less noise than a standard EMA.
* **TEMA (Triple Exponential Moving Average):**
* *Logic:* Calculated as $3 \times EMA - 3 \times EMA(EMA) + EMA(EMA(EMA))$. This effectively eliminates the lag inherent in single and double EMAs, making it an extremely fast-tracking indicator for scalping.
#### 3. Advanced & Adaptive Averages
* **HMA (Hull Moving Average):**
* *Logic:* A composite formula involving Weighted Moving Averages: ASX:WMA (2 \times Integer(n/2)) - WMA(n)$. The result is then smoothed by a $\sqrt{n}$ WMA.
* *Effect:* It eliminates lag almost entirely while managing to improve curve smoothness, solving the traditional trade-off between speed and noise.
* **ZLEMA (Zero Lag Exponential Moving Average):**
* *Logic:* This calculation attempts to remove lag by modifying the data source before smoothing. It calculates a "lag" value $(length-1)/2$ and applies an EMA to the data: $Source + (Source - Source )$. This creates a projection effect that tracks price tightly.
* **T3 (Tillson T3 Moving Average):**
* *Logic:* A complex smoothing technique that runs an EMA through a filter multiple times using a "Volume Factor" (set to 0.7 in this script).
* *Effect:* It produces a curve that is incredibly smooth and free of "overshoot," making it excellent for filtering out market chop.
* **ALMA (Arnaud Legoux Moving Average):**
* *Logic:* Uses a Gaussian distribution (bell curve) to assign weights. It allows the user to offset the moving average (moving the peak of the weight) to align it perfectly with the price, balancing smoothness and responsiveness.
* **LSMA (Least Squares Moving Average):**
* *Logic:* Calculates the endpoint of a Linear Regression line for the lookback period. It essentially guesses where the price "should" be based on the best-fit line of the recent trend.
* **VWMA (Volume Weighted Moving Average):**
* *Logic:* Weights the closing price by the volume of that bar.
* *Effect:* Prices on high volume days pull the MA harder than prices on low volume days. This is excellent for validating true trend strength (i.e., a breakout on high volume will move the VWMA significantly).
---
### 🛠 Features & Settings
* **Universal Switching:** Change the `Fast MA` and `Slow MA` types instantly via the settings menu.
* **Trend Cloud:** A dynamic background fill (Green/Red) highlights the crossover zone for immediate visual trend identification.
* **Strategy Mode:** Built-in Backtesting logic triggers `LONG` entries when Fast MA crosses over Slow MA, and `EXIT` when Fast MA crosses under.
### ⚠️ Disclaimer
This script is intended for educational and research purposes. The wide variety of MA combinations can produce vastly different results. Past performance is not indicative of future results. Please use proper risk management.

Stockbee 8% 4% 9M + MA CrossoversThis is another version of my Stockbee 9% 4% 9M script, now enhanced with moving average crossovers to highlight trend shifts more effectively.
The crossovers are displayed in the same visual style as the 9 million volume indicator from the original script but use different shapes and forms for better distinction.
All crossover visuals can be customized to your liking—you can adjust their appearance to fit your charting style or preference.

RSI MA Cross + Divergence Signal (V2) Core Logic
RSI + Moving Average
The script calculates a standard RSI (default 14).
It then overlays a moving average (SMA/EMA/WMA, default 9).
When RSI crosses above its MA → bullish momentum.
When RSI crosses below its MA → bearish momentum.
Divergence Filter
Signals are only valid if there’s confirmed divergence:
Bullish divergence: Price makes a lower low, RSI makes a higher low.
Bearish divergence: Price makes a higher high, RSI makes a lower high.
Overbought / Oversold Filter
Optional extra:
Bullish signals only valid if RSI ≤ 30 (oversold).
Bearish signals only valid if RSI ≥ 70 (overbought).
This ensures signals happen in “stretched” conditions.
Risk & Trade Management
Entries taken only when all conditions align.
Exits can be managed with ATR stops, partial take-profits, breakeven moves, and trailing stops (we coded these in the strategy version).
Cooldown, session filters, and daily loss guard to keep risk tight.
🔹 Strengths
✅ High selectivity: Combining RSI cross + divergence + OB/OS means signals are rare but higher quality.
✅ Great at catching reversals: Divergence highlights where price may be running out of steam.
✅ Risk management baked in: ATR stops + partial exits smooth out equity curve.
✅ Works across markets: ES, FX, crypto — anywhere RSI divergences are respected.
✅ Flexible: You can loosen/tighten filters depending on aggressiveness.
🔹 Weaknesses
❌ Lag from pivots: Divergence only confirms after a few bars → you enter late sometimes.
❌ Choppy in ranges: In sideways markets, RSI divergences appear often and whipsaw.
❌ Filters reduce signals: With all filters ON (divergence + OB/OS + trend + session), signals can be very rare — may under-trade.
❌ Not standalone: Needs higher-timeframe context (trend, liquidity pools) to avoid counter-trend entries.
🔹 Best Ways to Trade It
Use Higher Timeframe Bias
Run the strategy on 15m/1H, but only trade in direction of higher timeframe trend (e.g., 4H EMA).
Example: If daily is bullish → only take bullish divergences.
Pair With Structure
Look for signals at key zones: HTF support/resistance, VWAP, or FVGs.
Divergence + RSI cross inside an FVG is a strong entry trigger.
Adjust OB/OS for Volatility
For crypto/FX: use 35/65 instead of 30/70 (markets trend harder).
For ES/S&P: 30/70 works fine.
Risk Management Is King
Use partial exits: take profit at 1R, trail rest.
Size by % of equity (we coded this into the strategy).
Avoid News Spikes
Divergences break down around CPI, NFP, Fed announcements — stay flat.
🔹 When It Shines
Trending markets that make extended pushes → clean divergences.
Reversal zones (oversold → bullish bounce, overbought → bearish fade).
Swing trading (15m–4H) — less noise than 1m/5m scalping.
🔹 When to Avoid
Low volatility chop → lots of false divergences.
During high-impact news → RSI swings wildly.
In strong one-way trends without pullbacks — divergence keeps calling tops/bottoms too early.
✅ Summary:
This is a reversal-focused RSI divergence strategy with strict filters. It’s powerful when combined with higher-timeframe bias + structure confluence, but weak if traded blindly in choppy or news-driven conditions. Best to treat it as a precision entry trigger, not a full system — layer it on top of your FVG/ORB framework for maximum edge.

Smooth BTCSPL [GiudiceQuantico] – Dual Smoothed MAsSmooth BTCSPL – Dual Smoothed MAs
What it measures
• % of Bitcoin addresses in profit vs loss (on-chain tickers).
• Spread = profit % − loss % → quick aggregate-sentiment gauge.
• Optional alpha-decay normalisation ⇒ keeps the curve on a 0-1 scale across cycles.
User inputs
• Use Alpha-Decay Adjusted Input (true/false).
• Fast MA – type (SMA / EMA / WMA / VWMA) & length (default 100).
• Slow MA – type & length (default 200).
• Colours – Bullish (#00ffbb) / Bearish (magenta).
Computation flow
1. Fetch daily on-chain series.
2. Build raw spread.
3. If alpha-decay enabled:
alpha = (rawSpread − 140-week rolling min) / (1 − rolling min).
4. Smooth chosen base with Fast & Slow MAs.
5. Bullish when Fast > Slow, bearish otherwise.
6. Bars tinted with the same bull/bear colour.
How to read
• Fast crosses above Slow → rising “addresses-in-profit” momentum → bullish bias.
• Fast crosses below Slow → stress / capitulation risk.
• Price-indicator divergences can flag exhaustion or hidden accumulation.
Tips
• Keep in a separate pane (overlay = false); bar-colouring still shows on price chart.
• Shorter lengths for swing trades, longer for macro outlook.
• Combine with funding rates, NUPL or simple price-MA crossovers for confirmation.

Canuck Trading IndicatorOverview
The Canuck Trading Indicator is a versatile, overlay-based technical analysis tool designed to assist traders in identifying potential trading opportunities across various timeframes and market conditions. By combining multiple technical indicators—such as RSI, Bollinger Bands, EMAs, VWAP, MACD, Stochastic RSI, ADX, HMA, and candlestick patterns—the indicator provides clear visual signals for bullish and bearish entries, breakouts, long-term trends, and options strategies like cash-secured puts, straddles/strangles, iron condors, and short squeezes. It also incorporates 20-day and 200-day SMAs to detect Golden/Death Crosses and price positioning relative to these moving averages. A dynamic table displays key metrics, and customizable alerts help traders stay informed of market conditions.
Key Features
Multi-Timeframe Adaptability: Automatically adjusts parameters (e.g., ATR multiplier, ADX period, HMA length) based on the chart's timeframe (minute, hourly, daily, weekly, monthly) for optimal performance.
Comprehensive Signal Generation: Identifies short-term entries, breakouts, long-term bullish trends, and options strategies using a combination of momentum, trend, volatility, and candlestick patterns.
Candlestick Pattern Detection: Recognizes bullish/bearish engulfing, hammer, shooting star, doji, and strong candles for precise entry/exit signals.
Moving Average Analysis: Plots 20-day and 200-day SMAs, detects Golden/Death Crosses, and evaluates price position relative to these averages.
Dynamic Table: Displays real-time metrics, including zone status (bullish, bearish, neutral), RSI, MACD, Stochastic RSI, short/long-term trends, candlestick patterns, ADX, ROC, VWAP slope, and MA positioning.
Customizable Alerts: Over 20 alert conditions for entries, exits, overbought/oversold warnings, and MA crosses, with actionable messages including ticker, price, and suggested strategies.
Visual Clarity: Uses distinct shapes, colors, and sizes to plot signals (e.g., green triangles for bullish entries, red triangles for bearish entries) and overlays key levels like EMA, VWAP, Bollinger Bands, support/resistance, and HMA.
Options Strategy Signals: Suggests opportunities for selling cash-secured puts, straddles/strangles, iron condors, and capitalizing on short squeezes.
How to Use
Add to Chart: Apply the indicator to any TradingView chart by selecting "Canuck Trading Indicator" from the Pine Script library.
Interpret Signals:
Bullish Signals: Green triangles (short-term entry), lime diamonds (breakout), blue circles (long-term entry).
Bearish Signals: Red triangles (short-term entry), maroon diamonds (breakout).
Options Strategies: Purple squares (cash-secured puts), yellow circles (straddles/strangles), orange crosses (iron condors), white arrows (short squeezes).
Exits: X-cross shapes in corresponding colors indicate exit signals.
Monitor: Gray circles suggest holding cash or monitoring for setups.
Review Table: Check the top-right table for real-time metrics, including zone status, RSI, MACD, trends, and MA positioning.
Set Alerts: Configure alerts for specific signals (e.g., "Short-Term Bullish Entry" or "Golden Cross") to receive notifications via TradingView.
Adjust Inputs: Customize input parameters (e.g., RSI period, EMA length, ATR period) to suit your trading style or market conditions.
Input Parameters
The indicator offers a wide range of customizable inputs to fine-tune its behavior:
RSI Period (default: 14): Length for RSI calculation.
RSI Bullish Low/High (default: 35/70): RSI thresholds for bullish signals.
RSI Bearish High (default: 65): RSI threshold for bearish signals.
EMA Period (default: 15): Main EMA length (15 for day trading, 50 for swing).
Short/Long EMA Length (default: 3/20): For momentum oscillator.
T3 Smoothing Length (default: 5): Smooths momentum signals.
Long-Term EMA/RSI Length (default: 20/15): For long-term trend analysis.
Support/Resistance Lookback (default: 5): Periods for support/resistance levels.
MACD Fast/Slow/Signal (default: 12/26/9): MACD parameters.
Bollinger Bands Period/StdDev (default: 15/2): BB settings.
Stochastic RSI Period/Smoothing (default: 14/3/3): Stochastic RSI settings.
Uptrend/Short-Term/Long-Term Lookback (default: 2/2/5): Candles for trend detection.
ATR Period (default: 14): For volatility and price targets.
VWAP Sensitivity (default: 0.1%): Threshold for VWAP-based signals.
Volume Oscillator Period (default: 14): For volume surge detection.
Pattern Detection Threshold (default: 0.3%): Sensitivity for candlestick patterns.
ROC Period (default: 3): Rate of change for momentum.
VWAP Slope Period (default: 5): For VWAP trend analysis.
TradingView Publishing Compliance
Originality: The Canuck Trading Indicator is an original script, combining multiple technical indicators and custom logic to provide unique trading signals. It does not replicate existing public scripts.
No Guaranteed Profits: This indicator is a tool for technical analysis and does not guarantee profits. Trading involves risks, and users should conduct their own research and risk management.
Clear Instructions: The description and usage guide are detailed and accessible, ensuring users understand how to apply the indicator effectively.
No External Dependencies: The script uses only built-in Pine Script functions (e.g., ta.rsi, ta.ema, ta.vwap) and requires no external libraries or data sources.
Performance: The script is optimized for performance, using efficient calculations and adaptive parameters to minimize lag on various timeframes.
Visual Clarity: Signals are plotted with distinct shapes and colors, and the table provides a concise summary of market conditions, enhancing usability.
Limitations and Risks
Market Conditions: The indicator may generate false signals in choppy or low-liquidity markets. Always confirm signals with additional analysis.
Timeframe Sensitivity: Performance varies by timeframe; test settings on your preferred chart (e.g., 5-minute for day trading, daily for swing trading).
Risk Management: Use stop-losses and position sizing to manage risk, as suggested in alert messages (e.g., "Stop -20%").
Options Trading: Options strategies (e.g., straddles, iron condors) carry unique risks; consult a financial advisor before trading.
Feedback and Support
For questions, suggestions, or bug reports, please leave a comment on the TradingView script page or contact the author via TradingView. Your feedback helps improve the indicator for the community.
Disclaimer
The Canuck Trading Indicator is provided for educational and informational purposes only. It is not financial advice. Trading involves significant risks, and past performance is not indicative of future results. Always perform your own due diligence and consult a qualified financial advisor before making trading decisions.

ReadyFor401ks Just Tell Me When!ReadyFor401ks Just Tell Me When!
LET ME START BY SAYING. NO INDICATOR WILL HELP YOU NAIL THE PERFECT ENTRY/EXIT ON A TRADE. YOU SHOULD ALWAYS EDUCATE YOURSELF AND HAVE A BASIC UNDERSTANDING OF INVESTING, TRADING, CHART ANALYSIS, AND THE RISKS INVOLVED WITH. THAT BEING SAID, WITH THE RIGHT ADJUSTMENTS, IT'S PRETTY D*$N CLOSE TO PERFECTION!
This indicator is designed to help traders identify t rend direction, continuation signals, and potential exits based on a dynamic blend of moving averages, ATR bands, and price action filters. Whether you’re an intraday trader scalping the 5-minute chart or a swing trader analyzing the weekly timeframe for LEAPS , this tool provides a clear, rule-based system to help guide your trading decisions.
⸻
Key Features & Benefits
🔹 Customizable Trend Power (Baseline) Calculation
• Choose from JMA, EMA, HMA, TEMA, DEMA, SMA, VAMA, and WMA for defining your baseline trend direction.
• The baseline helps confirm whether the market is in a bullish or bearish phase.
🔹 ATR-Based Trend Continuation & Volatility Measurement
• ATR bands dynamically adjust to market conditions, helping you spot breakouts and fakeouts.
• The indicator detects when price violates ATR range , which often signals impulse moves.
🔹 Clear Entry & Exit Signals
• Uses a Continuation MA (SSL2) to confirm trends.
• Includes a separate Exit MA (SSL3) that provides crossover signals to indicate when to exit trades or reverse positions .
• Plots trend continuation circles when ATR conditions align with trend signals.
🔹 Keltner Channel Baseline for Market Structure
• A modified Keltner Channel is integrated into the baseline to help filter out choppy conditions .
• If price remains inside the baseline, the market is in consolidation , while breakouts beyond the bands indicate strong trends .
🔹 Adaptive Color Coding for Market Conditions
• Bars change color based on momentum, making trend direction easy to read.
• Green = Bullish Trend, Red = Bearish Trend, Gray = Neutral/Chop.
🔹 Flexible Alerts for Trade Management
• Get real-time alerts when the Exit MA crosses price , helping you l ock in profits or switch directions .
⸻
How to Use This Indicator for Different Trading Styles
🟢 For Intraday Trading (5-Minute Chart Setup)
• Faster MA settings help react quickly to momentum shifts.
• Ideal for scalping breakouts, trend continuation setups, and intraday reversals.
• Watch for ATR violations and price interacting with the baseline/Keltner Channel for entries.
--------------------------------
My Settings for Intraday Trading on 5min Chart
ATR Period: 15
ATR Multi: 1
ATR Smoothing: WMA
Trend Power based off of: JMA
Trend Power Period: 30
Continuation Type: JMA
Continuation Length: 20
Calculate Exit of what MA?: HMA
Calculate Exit off what Period? 30
Source of Exit Calculation: close
JMA Phase *APPLIES TO JMA ONLY: 3
JMA Power *APPLIES TO JMA ONLY: 3
Volatility Lookback Period *APPLIES TO VAMA ONLY 30
Use True Range for Channel? Checked
Base Channel Multiplier: 0.4
ATR Continuation Criteria: 1.1
----------------------------------
🔵 For Swing Trading & LEAPS (Weekly Chart Setup - Default Settings)
• Slower MAs provide a broader view of trend structure.
• Helps capture multi-week trend shifts and confirm entry points for longer-term trades.
• Weekly ATR bands highlight when stocks are entering overextended conditions.
💡 Example:
Let’s say you’re looking at TSLA on a Weekly Chart using the default settings. You notice that price crosses above the continuation MA (SSL2) while remaining above the baseline (trend power MA). The bar turns green, and price breaks above ATR resistance, signaling a strong bullish continuation. This could be a great opportunity to enter a long-term swing trade or LEAPS options position.
On the flip side, if price reverses below the Exit MA (SSL3) and turns red while breaking the lower ATR band, it might signal a good time to exit longs or enter a short trade.
⸻
Final Thoughts
The ReadyFor401ks Just Tell Me When! indicator is an all-in-one trading system that simplifies trend-following, volatility measurement, and trade management. By integrating multiple moving average types, ATR filters, and clear visual cues, it allows traders to stay disciplined and remove emotions from their trading decisions.
✅ Perfect for scalpers, day traders, and swing traders alike!
🔔 Set up alerts for automated trade signals and never miss a key move!
💬 If you find this indicator useful, leave a comment and share how you use it in your trading! 🚀

Moving Average Crossover StrategyCertainly! Below is an example of a professional trading strategy implemented in Pine Script for TradingView. This strategy is a simple moving average crossover strategy, which is a common approach used by many traders. It uses two moving averages (a short-term and a long-term) to generate buy and sell signals.
Input Parameters:
shortLength: The length of the short-term moving average.
longLength: The length of the long-term moving average.
Moving Averages:
shortMA: The short-term simple moving average (SMA).
longMA: The long-term simple moving average (SMA).
Conditions:
longCondition: A buy signal is generated when the short-term MA crosses above the long-term MA.
shortCondition: A sell signal is generated when the short-term MA crosses below the long-term MA.
Trade Execution:
The strategy enters a long position when the longCondition is met.
The strategy enters a short position when the shortCondition is met.
Plotting:
The moving averages are plotted on the chart.
Buy and sell signals are plotted as labels on the chart.
How to Use:
Copy the script into TradingView's Pine Script editor.
Adjust the shortLength and longLength parameters to fit your trading style.
Add the script to your chart and apply it to your desired timeframe.
Backtest the strategy to see how it performs on historical data.
This is a basic example, and professional traders often enhance such strategies with additional filters, risk management rules, and other indicators to improve performance.
